First Steps in Observability
·6 min read
Observability? Ok, buzzword…
When I started at Signal Sciences, my first priority was to gain more insight into our product’s operational performance and the impact of that performance on our customers. I initiated candid conversations about the raw performance of our systems and delved into operational details of support incidents, logs, and metrics to explain the impact of our performance to our customers, the business, and key stakeholders. This insight on product performance goes by another name: the industry buzzword observability.
Observability means fully understanding the health and performance of internal systems and how your system handles unknown-unknowns (things that you are not aware of and don’t understand). It also means telling the story of how your system got in its current state, by observing its output and without shipping new code. No product is good enough to not care about observability.
Within Signal Sciences’ engineering and operations organizations, we’re meticulously standardizing what observability means and the value it brings. Over time, our product has evolved from a single, monolithic app to a cloud native, microservices-centric application which makes health and performance more challenging to measure and understand. From a single code base to interconnected code bases and containers, spotting the root cause can mean looking at a network of systems simultaneously.
It’s always good to see our customer base continue to grow, but more customers means a strong demand for a consistently high-performing product. We know we won’t meet customer expectations without investing in observability. This is our story and journey in using observability as that guiding principle.
Cross the line again, I dare you
Our customers fall in love with our product the moment they see the protection and visibility they gain from our next-gen WAF. Our proprietary SmartParse technology gives us this advantage, but our customers still have to trust us enough to install our solution on their web server. Performance is understandably a serious concern to our customers, and we know they won’t adopt a security technology if it means compromising their experience.
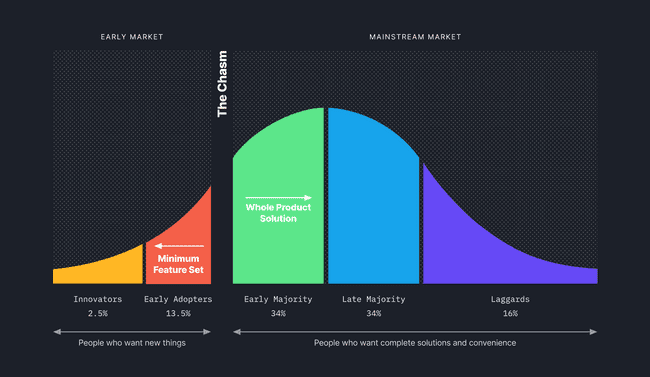
Geoffrey Moore introduces an idea about customers and their demand for product performance. He summarizes the problems and challenges between the early majority market and the mainstream market. The mainstream market is what most companies strive to win over: a group of customers that are loyal, pragmatic, and demand high product performance. This leap from getting to a Minimum Viable Product (MVP) to a full product feature set is what it takes to “cross the chasm”.
Crossing the chasm would be difficult without observability. How can you and your customers confidently know your product is performing well? What can go wrong with your systems? We can answer these questions by knowing and understanding where internal performance bottlenecks are and finding solutions for them. Crossing the chasm has brought us interesting organizational challenges and observability will continue to unlock great insight for us and our customers.
Logs and traces and metrics, oh my!
Let’s dig a bit deeper into what makes a system observable. A common idea around observability is the understanding of the three pillars: logs, traces, and metrics.
- Logs represent a single transaction of a system.
- Metrics are what it took a system to perform a unit of work.
- Traces are following a transaction through a system by applying identifiers.
Ben Sigelman gives an interesting perspective about the three pillars:
A common mistake that [companies] make is to look at each of the pillars in isolation, and then evaluate and implement individual solutions to address each pillar. Instead, try taking a holistic approach.
Focusing on each individual pillar won’t make systems more observable and viewing them holistically is a better approach. This is precisely where Signal Sciences is starting—understanding each of these pillars in unison and giving us insight into our infrastructure performance.
Not every observability tool can fully address all three pillars, but so far we’ve found Datadog best meets our current needs.

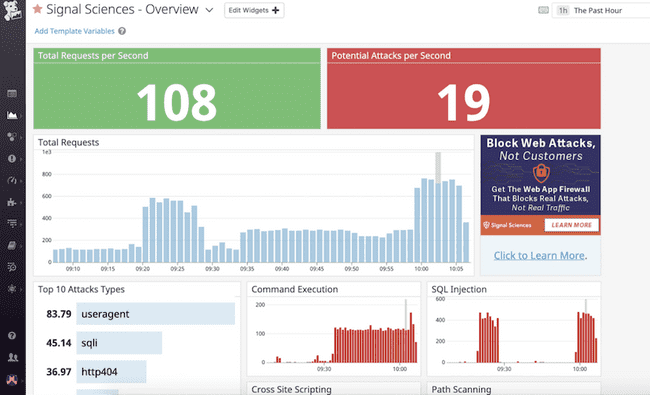
The image above is an example of the recent Signal Sciences and Datadog integration—where we support a customizable setup for our customers to generate their own security-related dashboards. Internally, we used the push method by installing Datadog agents in every part of our infrastructure to push logs, metrics, and traces for Datadog to analyze data. We then created high- to low-level services dashboards placed around our offices to continually observe product performance.
This was our first step in providing more transparency on how our product and infrastructure was performing. Second, we collectively agreed on how our infrastructure should be performing to achieve the highest level of customer value. These steps alone have unlocked great strides in understanding our complex infrastructure systems.
Looking into the future. Sensational…
In our current state, we have software agents deployed in customer environments, in the cloud, and container configurations. It’s critical to know their health and performance, and observability has helped us mitigate outages and customer incidents with just the steps we’ve taken so far. In one case, these steps helped us be proactive in mitigating the loss of request data collected from our agents. Losing agent data can generate false positives or requests to fail open, and malicious attacks may get through to our customer’s web server. Ultimately, observability will help us mitigate these issues and maintain trust with our customers.
Looking forward, we plan to use Datadog to give us visibility and data on solving unknown-unknowns. We also plan to add more structure to our logs, enable APM (Application Performance Monitoring) throughout our infrastructure hosts, and understand performance from a network layer (or network performance monitoring). All decisions to continually deliver a high performance, world-class security platform to our customers.
Conclusions you can jump to
Observability continues to be a great method and lense for Signal Sciences to understand product and infrastructure performance. Helping answer any set of questions about increasingly complex and containerized systems. Now that we understand the performance expectations from our Early Majority customers, we aim to exceed those expectations.
We continue to protect 300 billion web requests every week, deploy more agents in complex customer environments, and block malicious requests with a low false positive rate while expanding our security platform. We’re excited to continue delivering visionary security solutions with observability as a guiding principle.
